텐서플로우 자격증 준비를 위한 공부를 하려고 합니다.
시험 문제 유형은 아래와 같으며 coursera와 udacity 강의를 보고 준비하려고 합니다.
-
Category 1: Basic / Simple model
-
Category 2: Model from learning dataset
-
Category 3: Convolutional Neural Network with real-world image dataset
-
Category 4: NLP Text Classification with real-world text dataset
-
Category 5: Sequence Model with real-world numeric dataset
www.udacity.com/course/intro-to-tensorflow-for-deep-learning--ud187
Intro to TensorFlow for Deep Learning | Udacity Free Courses
Developed by Google and Udacity, this course teaches a practical approach to deep learning for software developers.
www.udacity.com
www.coursera.org/learn/introduction-tensorflow/home/welcome
Coursera | Online Courses & Credentials From Top Educators. Join for Free | Coursera
Learn online and earn valuable credentials from top universities like Yale, Michigan, Stanford, and leading companies like Google and IBM. Join Coursera for free and transform your career with degrees, certificates, Specializations, & MOOCs in data science
www.coursera.org
Category 1: Basic / Simple model
섭씨에서 화씨로 변환하는 간단한 예제에 대해 알아보려고 합니다.
f = c * 1.8 + 32 가 공식인데 텐서플로우를 통해 모델을 학습해보려고 합니다.
기계학습을 위한 필요한 패키지를 import한뒤에 학습을 위한 데이터를 세팅합니다.
import tensorflow as tf
import numpy as np
import logging
logger = tf.get_logger()
logger.setLevel(logging.ERROR)
celsius_q = np.array([-40, -10, 0, 8, 15, 22, 38], dtype=float)
fahrenheit_a = np.array([-40, 14, 32, 46, 59, 72, 100], dtype=float)
for i,c in enumerate(celsius_q):
print("{} 섭씨는 = {} 화씨입니다.".format(c, fahrenheit_a[i]))
그후 모델을 만들기 위해서 하나의 레이어를 만듭니다. 1차원 배열이 하나있는 유일한 레이어를 만드려고 합니다.
model = tf.keras.Sequential([
  tf.keras.layers.Dense(units=1, input_shape=[1])
])
다음은 모델을 컴파일 하려고 합니다.
Loss function은 원하는 결과에서 예측값의 차이이고(손실함수)
Optimizer function은 손실을 줄이기 위해 내부 값을 조정하는 방법입니다.
model.compile(loss='mean_squared_error',
              optimizer=tf.keras.optimizers.Adam(0.1))
fit 메서드를 이용하여 모델을 훈련시킵니다.
history = model.fit(celsius_q, fahrenheit_a, epochs=500, verbose=False)
print("Finished training the model")
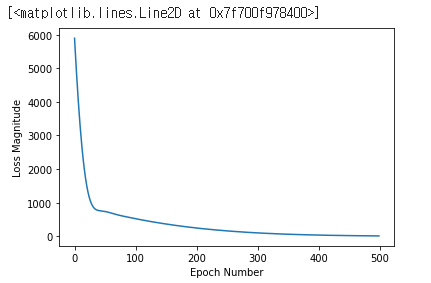
모델 손실이 어떻게 감소하는지 시각화하겠습니다.
import matplotlib.pyplot as plt
plt.xlabel('Epoch Number')
plt.ylabel("Loss Magnitude")
plt.plot(history.history['loss'])
'Data Analysis > Tensorflow' 카테고리의 다른 글
| [tensorflow] horses_or_humans (2) | 2021.01.02 |
|---|---|
| [tensorflow] Fashion MNIST (0) | 2020.12.30 |
| [tensorflow] pycharm 설치 및 환경설정 (0) | 2020.12.18 |
| [tensorflow2][CNN] 영상 자동 모자이크 시스템 (0) | 2020.07.23 |
| [tensorflow] iris data (0) | 2020.01.14 |

