plotly를 이용한 2020.04 ~ 2021.01 까지의 한국 코로나 데이터 시각화를 하려고 합니다.
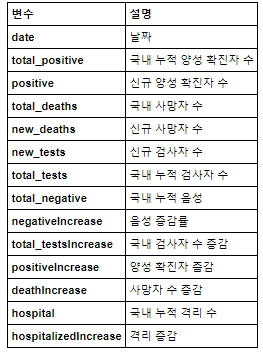
피처에 대한 설명은 아래와 같습니다.
데이터 불러오기
사용된 데이터의 출처는 아래에 남겼습니다.
import dash
import dash_table
import dash_core_components as dcc
import dash_html_components as html
from dash.dependencies import Input, Output, State
import pandas as pd
import plotly
import numpy as np

import plotly.express as px
from plotly.subplots import make_subplots
import plotly.graph_objects as go
import matplotlib.pyplot as plt
import plotly.figure_factory as ff
import csv
from urllib.request import urlopen
import urllib.request
df = pd.read_csv('korea_covid19.csv')
df.head(10)데이터 FE이 끝난 최종 데이터를 확인해 보겠습니다.
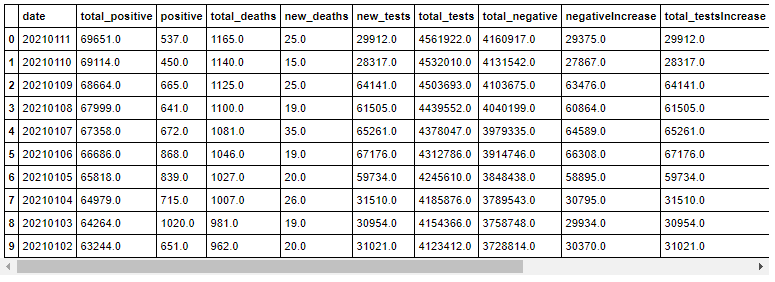
df.head()
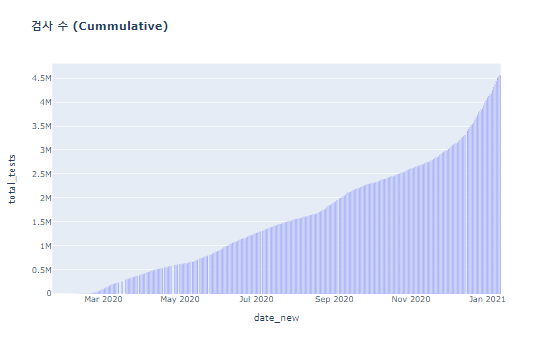
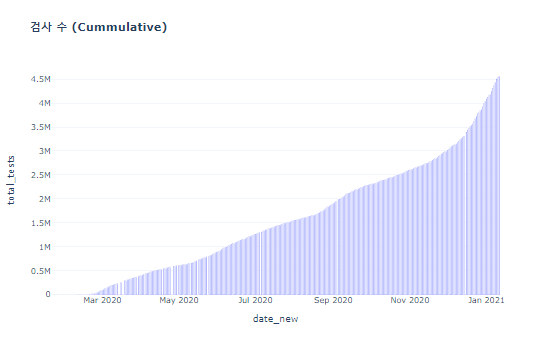
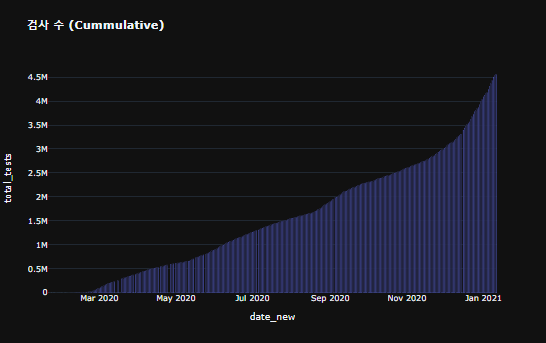
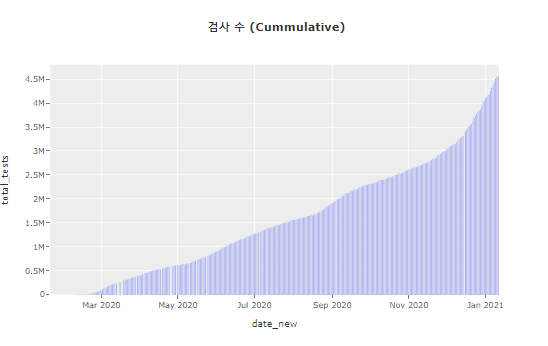
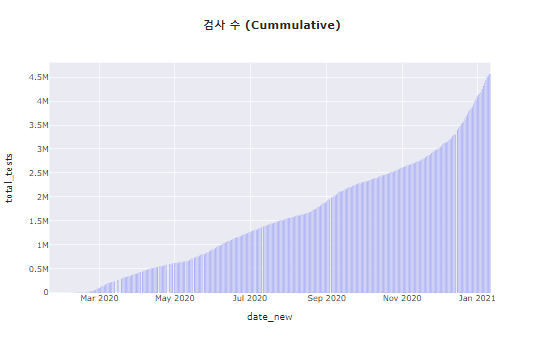
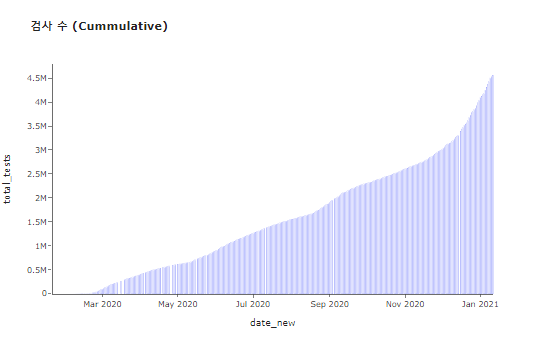
plotly에는 다양한 테마가 있는데 각각의 테마를 확인해 보려고합니다.
각각의 그래프 테마는 plotly, plotly_white, plotly_dark, ggplot2, seaborn, simple_white, none을 뜻합니다.
for template in ["plotly", "plotly_white", "plotly_dark", "ggplot2", "seaborn", "simple_white", "none"]:
        fig0 = px.bar(df,
                      x="date_new",
                      y="total_tests",
                      hover_data=['total_tests'],
                      title="<b> 검사 수 (Cummulative)</b>")
        fig0.update_layout(template=template)
        fig0.show()
-
plotly
-
plotly_white
-
plotly_dart
-
ggplot2
-
seaborn
-
simple_white, none
-
none

매일 코로나 검사를 한 사람들의 수를 도식화 하였습니다.
마우스를 올리면(hover) hover_data에 설정한 값이 도출됩니다.
fig0 = px.bar(df
             ,x="date_new"
             ,y="total_tests"
             ,hover_data=['total_tests']
             ,title="<b>검사 수 (Cummulative)</b>")
fig0.update_layout(
    template='plotly_dark'
)
fig0.show()
시간의 경과에 따른 검사 수 및 양성 퍼센트 변화에 대한 시각화입니다.
data_melt = pd.melt(data, id_vars=['date_new'],
                     value_vars=['positiveIncrease',
                                 'total_testsIncrease'])

fig1 = make_subplots(specs=[[{"secondary_y": True}]])
fig1 = px.line(data_melt, x='date_new', y='value', color='variable')

fig1.add_trace(
    go.Scatter(x=date, y=percent_positive, name="percent_positive"),
    secondary_y=False)

fig1.update_layout(title_text="<b>코로나 양성, 검사 퍼센트 변화 </b>",
                   template='plotly_dark',
                   showlegend=False)
fig1.update_xaxes(title_text="<b>Date</b>")
fig1.update_yaxes(title_text="<b>Count</b>", secondary_y=False)
fig1.show()
시간에 따른 코로나 양성 변화율을 시각화하였습니다.
fig2 = make_subplots(specs=[[{"secondary_y": True}]])
fig2.add_trace(go.Scatter(x=date,
                          y=percent_positive,
                          name="percent_positive",
                          marker_color=px.colors.qualitative.D3[3]),
               secondary_y=True)

fig2.update_layout(title_text="<b>코로나 양성 변화율</b>")
fig2.update_xaxes(title_text="<b>Date</b>")
fig2.update_yaxes(title_text="<b>Percent</b>", secondary_y=True)
fig2.update_layout(barmode='stack')
fig2.update_traces(marker_line_width=.01)

fig2.update_layout(template='plotly_dark')
fig2.show()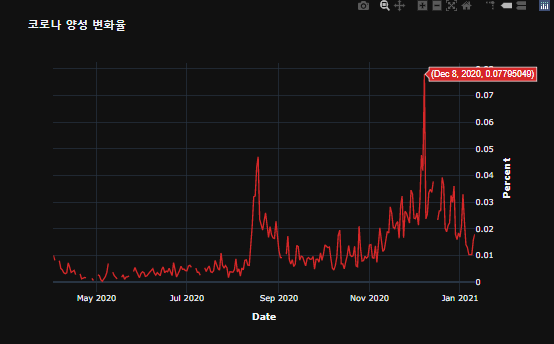
시간의 경과에 따른 총 검사자 수, 총 양성 및 음성 수를 보여줍니다.
fig3 = make_subplots(specs=[[{"secondary_y": True}]])

fig3.add_trace(go.Bar(x=date,
                      y=negativeIncrease,
                      name="negativeIncrease",
                      marker_color=px.colors.qualitative.Pastel1[3]),
               secondary_y=False
              )

fig3.add_trace(go.Bar(x=date,
                      y=positiveIncrease,
                      name="positiveIncrease"),
               secondary_y=False)

fig3.add_trace(go.Scatter(x=date,
                          y=totalTestResultsIncrease,
                          opacity=.7,
                          name="totalTestResultsIncrease",
                          mode="markers",
                          marker_color=px.colors.qualitative.Plotly[3]),
               secondary_y=False)

fig3.update_layout(title_text="<b>총 검사자 수 양성 음성 수</b>")
fig3.update_xaxes(title_text="<b>Date</b>")
fig3.update_yaxes(title_text="<b>Count Cases</b>", secondary_y=False)
fig3.update_layout(barmode='stack')
fig3.update_traces(marker_line_width=.01)
fig3.update_layout(template='plotly_dark',
                   legend=dict(orientation="h",
                               yanchor="bottom", #서브타이틀 높이위치
                               y=1.02,
                               xanchor="right", #서브타이틀 좌우위치
                               x=1
                              )
                  )
fig3.show()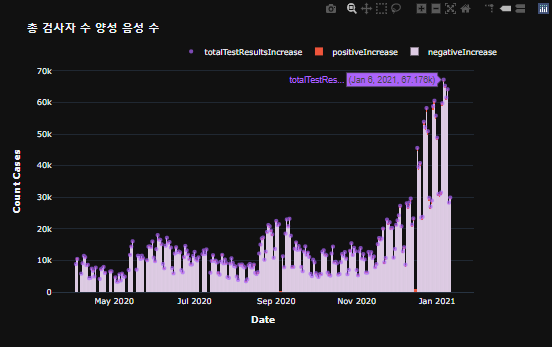
시간의 경과에 따른 총 검사자 수, 총 양성 및 음성 로그 스케일을 보여줍니다.
fig4 = make_subplots(specs=[[{"secondary_y": True}]])
fig4.add_trace(go.Scatter(x=date,
                          y=negativeIncrease,
                          name="negativeIncrease",
                          line=dict(width=0.5, color='rgb(111, 231, 219)'),
                          stackgroup='one'),
                secondary_y=False)

fig4.add_trace(go.Scatter(x=date,
                          y=positiveIncrease,
                          fill='tonexty',
                          mode="markers+lines",
                          name="positiveIncrease"),
               secondary_y=False)

fig4.add_trace(go.Scatter(x=date,
                          y=totalTestResultsIncrease,
                          opacity=.7,
                          name="totalTestResultsIncrease",
                          line=dict(width=0.5, color='rgb(131, 90, 241)'),
                          stackgroup='one'),
               secondary_y=False)

fig4.update_layout(title_text="<b>총 검사자 수, 총 양성 및 음성 로그 스케일</b>")
fig4.update_xaxes(title_text="<b>Date</b>")
fig4.update_yaxes(title_text="<b>Count Cases</b>", secondary_y=False)
fig4.update_layout(barmode='stack')
fig4.update_traces(marker_line_width=.01)
fig4.update_layout(template='plotly_dark',
                   legend=dict(orientation="h",
                               yanchor="bottom",
                               y=1.02,
                               xanchor="right",
                               x=1
                              )
                  )
fig4.show()
시간에 따른 사망률과 격리율에 대한 퍼센트변화를 시각화했습니다.
fig7 = make_subplots(specs=[[{"secondary_y": True}]])
fig7.add_trace(go.Scatter(x=date,
                          y=death_pct_change,
                          name="death_pct_change",
                          marker_color=px.colors.qualitative.T10[0]),
               secondary_y=False)

fig7.add_trace(go.Scatter(x=date,
                          y=hospitalized_pct_change,
                          name="hospitalized_pct_change",
                          marker_color=px.colors.qualitative.T10[6]),
               secondary_y=False)

fig7.update_layout(title_text="<b>사망률과 격리율 퍼센트 변화</b>")
fig7.update_xaxes(title_text="<b>Date</b>")
fig7.update_yaxes(title_text="<b>Percent Change</b>", secondary_y=False)
fig7.update_layout(barmode='stack')
fig7.update_layout(legend=dict(orientation="h",
                               yanchor="bottom",
                               y=1.02,
                               xanchor="right",
                               x=1))
fig7.update_layout(template='plotly_dark')
fig7.show()
데이터는 출처는 아래와 같습니다.
-
our world in data(https://ourworldindata.org/)
reference : https://github.com/maxwellbade/covid_us_final/tree/master/covid_one_million
'BI > Python' 카테고리의 다른 글
| [python][QGIS] QGIS를 이용한 geojson 파일 만들기 (1) | 2021.06.18 |
|---|---|
| [python][plotly] dash와 heroku를 이용한 Dashboard 제작 (4) | 2021.02.01 |
| [python][plotly] geojson을 이용한 지도그리기 (4) (0) | 2021.01.13 |
| [python][Mapbox] geojson을 이용한 지도그리기 (3) (12) | 2021.01.12 |
| [python][지도시각화] 일본 도도부현 시각화 (0) | 2021.01.11 |

