
Google Kubernetes Engine(GKE) 상에서 Prometheus와 Grafana를 사용하여 클러스터의 모니터링을 설정하려고 합니다. 이를 통해 실시간으로 클러스터 상태를 감시하고, 성능 지표를 시각화해 보겠습니다.
모니터링을 위한 네임스페이스 생성
- 모니터링에 사용될 별도의 네임스페이스를 생성합니다. 네임스페이스는 리소스 관리와 분리를 통해 보다 체계적인 환경 관리에 도움을 줍니다.
$ kubectl create ns monitor
namespace/monitor created
Helm 리포지토리 추가 및 확인
- Prometheus와 Grafana를 설치하기 위해 Helm 차트 리포지토리를 추가합니다. Helm은 쿠버네티스 패키지 관리자로, 차트(chart)라고 불리는 패키지 형식을 사용하여 쿠버네티스 리소스의 정의, 설치, 업그레이드를 간편하게 할 수 있습니다.
$ helm repo add prometheus-community https://prometheus-community.github.io/helm-charts
"prometheus-community" has been added to your repositories
$ helm repo list
NAME URL
trino https://trinodb.github.io/charts
apache-airflow https://airflow.apache.org
prometheus-community https://prometheus-community.github.io/helm-chartsPrometheus와 Grafana 설치
- Prometheus와 Grafana를 포함하는 kube-prometheus-stack을 설치합니다. 이 스택은 쿠버네티스 클러스터 모니터링을 위한 필수 구성 요소들을 포함하고 있습니다.
$ helm upgrade --install prometheus prometheus-community/kube-prometheus-stack -n monitor --debug
NAME: prometheus-operator
LAST DEPLOYED: Sun Nov 05 05:48:44 2023
NAMESPACE: monitor
STATUS: deployed
REVISION: 1
NOTES:
kube-prometheus-stack has been installed. Check its status by running:
  kubectl --namespace monitor get pods -l "release=prometheus-operator"

Visit https://github.com/prometheus-operator/kube-prometheus for instructions on how to create & configure Alertmanager and Prometheus instances using the Operator.- 설치가 완료되면 설치된 Pod들의 상태를 확인할 수 있습니다.
$ kubectl get pods -n monitor
NAME                                                      READY   STATUS    RESTARTS   AGE
alertmanager-prometheus-operator-kube-p-alertmanager-0    2/2     Running   0          7m21s
prometheus-operator-grafana-655c84f78f-c7p52              3/3     Running   0          7m28s
prometheus-operator-kube-p-operator-7cc49d6ffb-g6x2n      1/1     Running   0          7m29s
prometheus-operator-kube-state-metrics-797d9866bd-796k4   1/1     Running   0          7m29s
prometheus-operator-prometheus-node-exporter-8qwgm        1/1     Running   0          7m29s
prometheus-prometheus-operator-kube-p-prometheus-0        2/2     Running   0          7m21s
Prometheus 및 Grafana의 접근 및 설정
- Prometheus 접근
- Prometheus 대시보드에 접근하여 Prometheus가 수집한 메트릭 데이터를 쿼리하고 확인할 수 있습니다.
$ kubectl port-forward -n monitor prometheus-prometheus-operator-kube-p-prometheus-0 9090- prometheus_http_requests_total"를 입력 후 Excute 하게 되면 아래와 같이 관련 메트릭을 Graph형태로 시각화(Visualization) 한 결과를 볼 수 있습니다

Grafana 접근
- Grafana 대시보드는 기본적으로 클러스터 내부에서만 접근 가능합니다. 내부에서 접근할 경우 개인의 환경마다 다르겠지만 CORS 문제로 인해 origin not allowed 에러가 발생했습니다.
$ kubectl port-forward prometheus-operator-grafana-655c84f78f-c7p52 -n monitor 3000
외부에서 접근하기 위해서는 LoadBalancer 타입의 서비스를 생성해야 합니다.
$ kubectl apply -f grafana-lb-service.yaml
service/grafana-lb-service created
grafana-lb-service.yaml 파일의 내용은 다음과 같습니다.
apiVersion: v1
kind: Service
metadata:
  name: grafana-lb-service
  namespace: monitor
spec:
  ports:
  - port: 8080
    targetPort: 3000
    name: http
  type: LoadBalancer
  selector:
    app.kubernetes.io/name: grafana
이제 생성된 LoadBalancer 서비스의 EXTERNAL-IP를 통해 Grafana에 접근할 수 있습니다.
$ kubectl get svc -n monitor
NAME                                           TYPE           CLUSTER-IP     EXTERNAL-IP      PORT(S)                      AGE
alertmanager-operated                          ClusterIP      None           <none>           9093/TCP,9094/TCP,9094/UDP   132m
grafana-lb-service                             LoadBalancer   10.52.7.10     34.173.xxx.xxx   8080:31160/TCP               18m
prometheus-operated                            ClusterIP      None           <none>           9090/TCP                     132m
prometheus-operator-grafana                    ClusterIP      10.52.7.171    <none>           80/TCP                       133m
prometheus-operator-kube-p-alertmanager        ClusterIP      10.52.13.49    <none>           9093/TCP,8080/TCP            133m
prometheus-operator-kube-p-operator            ClusterIP      10.52.12.67    <none>           443/TCP                      133m
prometheus-operator-kube-p-prometheus          ClusterIP      10.52.1.25     <none>           9090/TCP,8080/TCP            133m
prometheus-operator-kube-state-metrics         ClusterIP      10.52.12.176   <none>           8080/TCP                     133m
prometheus-operator-prometheus-node-exporter ClusterIP 10.52.7.57 <none> 9100/TCP 133m- EXTERNAL-IP(34.173.xxx.xxx)를 사용하여 브라우저에서 Grafana에 접근(http://34.173.xxx.xxx:8080)합니다. id와 pw는 admin/prom-operator입니다.

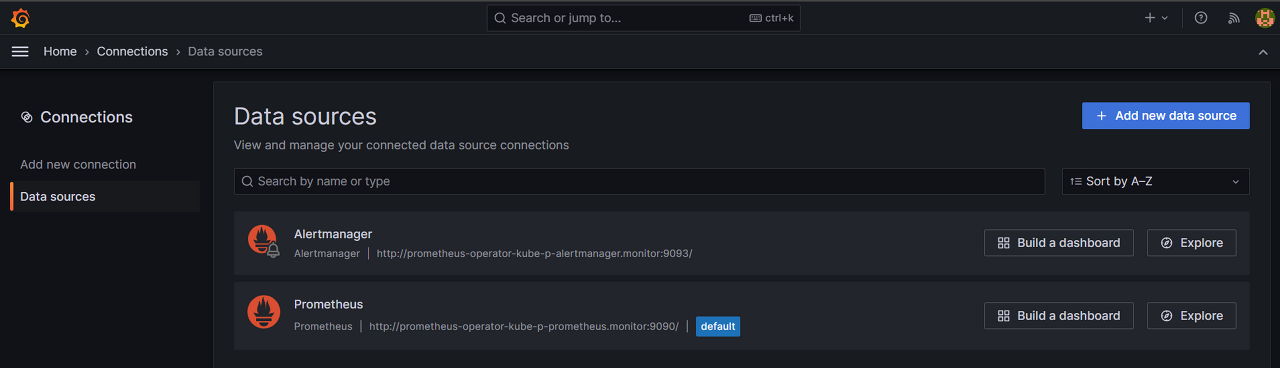
데이터 소스 및 대시보드 설정
- Grafana의 좌측 메뉴에서 "Configuration(구성)" > "Data Sources(데이터 소스)"를 선택합니다.

- Prometheus 데이터 소스는 이미 연결되어 있으므로, 추가 설정 없이 대시보드를 가져오거나 새로 생성할 수 있습니다.
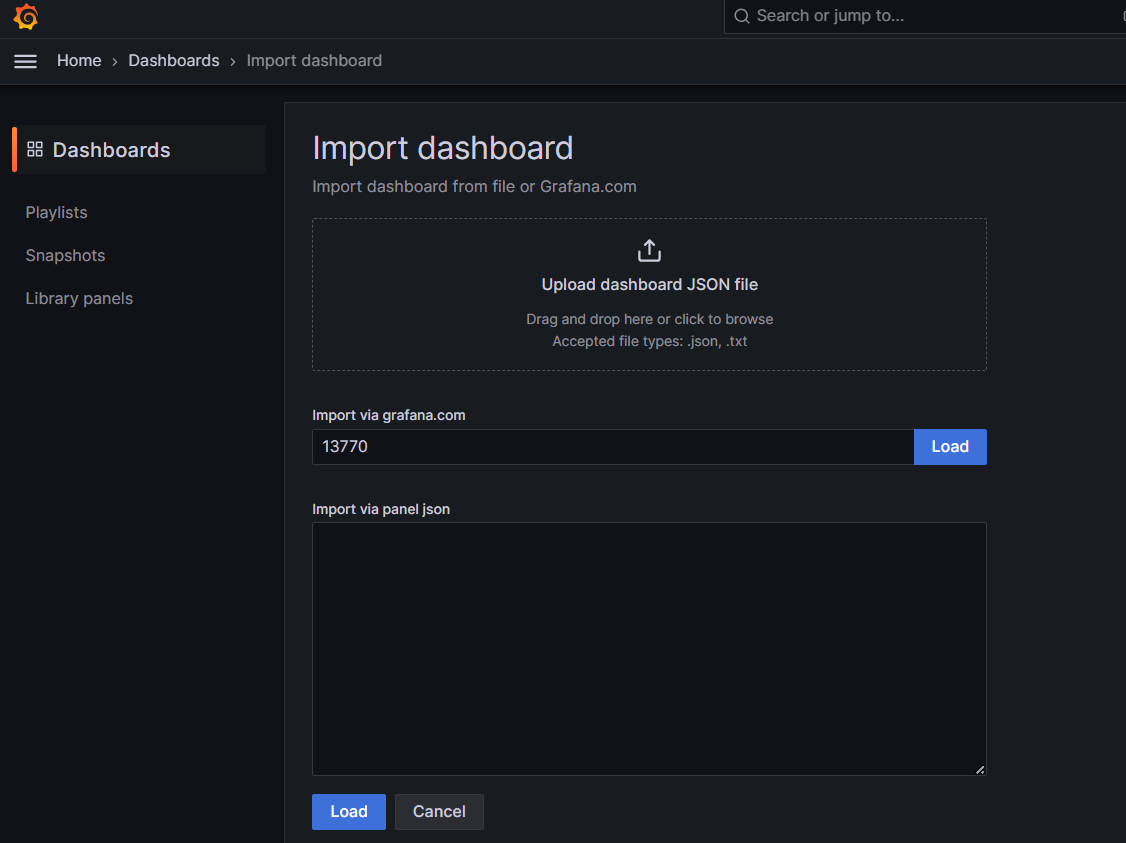
대시보드 가져오기
- Grafana에는 다양한 사전 구성된 대시보드 템플릿이 있습니다. Grafana.com의 대시보드 섹션에서 필요한 대시보드를 검색하고, 대시보드 ID를 사용하여 불러올 수 있습니다.
- "Create(생성)" > "Import(가져오기)"에서 쿠버네티스 올인원 모니터링 대시보드 대시보드 ID(13770)를 입력하고 대시보드를 불러옵니다.
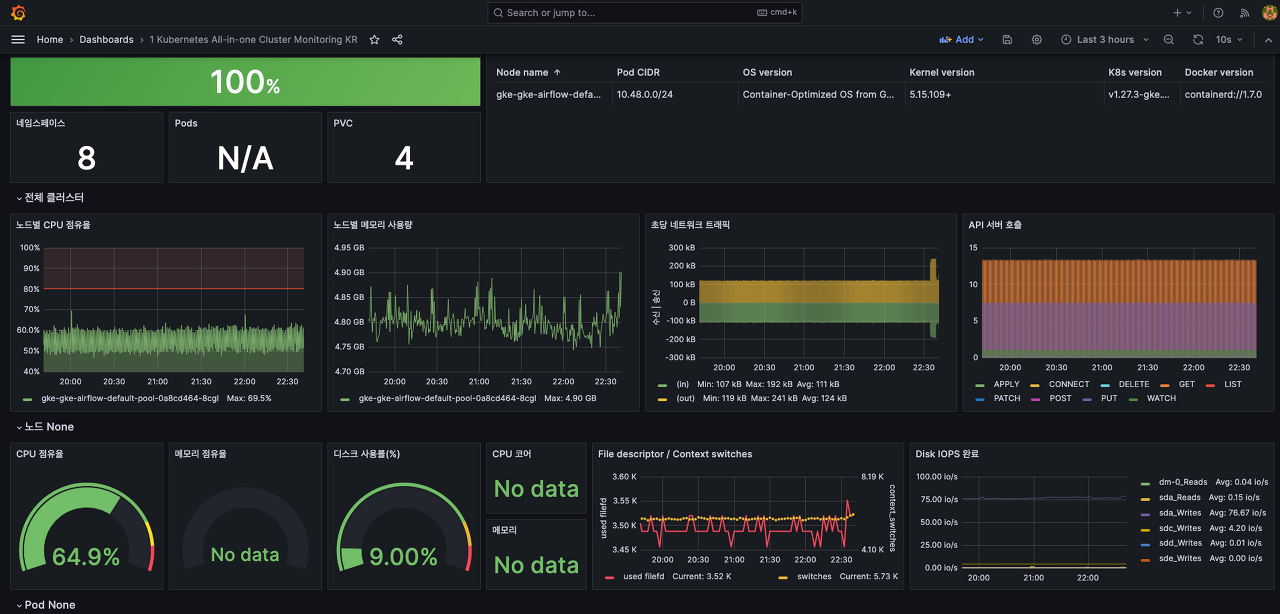
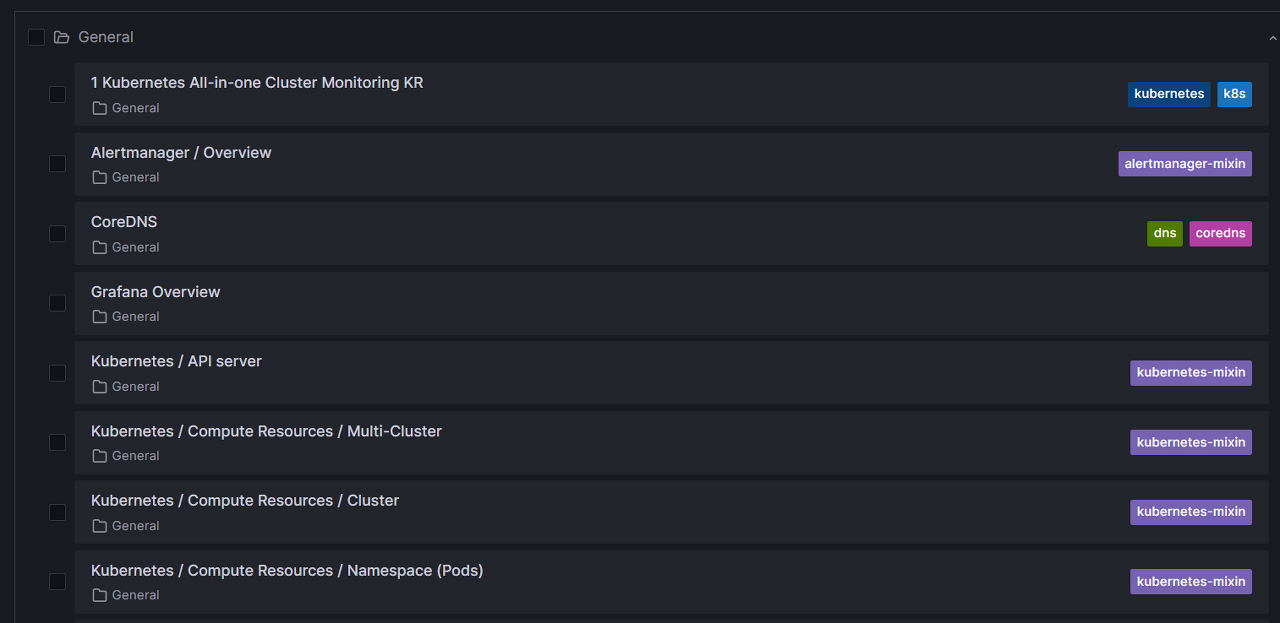
Import 한 대시보드 이외에도 다양한 대시보드를 제공합니다.
'Cloud' 카테고리의 다른 글
| [GKE] Trino를 사용하여 MinIO에 저장된 데이터 쿼리하기(1) - Hive Metastore MySQL로 구성 (1) | 2023.12.31 |
|---|---|
| [GCP] GKE의 Apache Airflow에 minio 연동하기 (1) | 2023.11.19 |
| [GCP] GKE의 Apache Airflow에 Slack 연동하기 (0) | 2023.11.05 |
| [GCP] GKE에 Terraform을 활용한 Airflow 배포 (1) | 2023.10.30 |
| [GCP] GKE에 Apache Airflow 배포 (0) | 2023.10.22 |